Verifiable Onchain Analytics from AI Hybrid Feeds for Crypto Traders

In the high-stakes arena of crypto trading, where volatility strikes without warning and liquidity shifts in seconds, verifiable onchain analytics from AI hybrid feeds stand as the ultimate edge. As a trader who’s navigated forex pairs and options for over a decade, I’ve seen how fusing AI forecasting with blockchain-verified data transforms gut instincts into high-probability setups. Platforms like AI Feed Oracle deliver this fusion, pulling real-time onchain states into predictive models that spot alpha before the herd. No more blind bets on unverified feeds; these hybrid systems cross-validate off-chain signals against immutable blockchain metrics, ensuring every trade signal is battle-tested.

The crypto market’s chaos demands precision. Traditional price feeds falter under manipulation risks, while pure onchain data misses broader context. Enter crypto trading AI oracles: they bridge this gap by ingesting TradFi datasets alongside crypto prices, enriching them with machine learning. Think Supra’s Threshold AI Oracles, pushing real-time reasoning directly on-chain for adaptive dApps, or Chainlink’s role in hybrid smart contracts that connect blockchains to external worlds without compromise.
Hybrid Oracles: Forging TradFi-Crypto Data Fusion
Building a hybrid oracle isn’t trivial; it requires merging disparate data streams into a single, tamper-proof feed. Guillaume Verbiguié’s insights on Medium outline merging traditional finance data with crypto assets, then layering AI for anomaly detection. This setup uses microservices architectures to unify onchain and offchain inputs, as Aetsoft details for AI trading bots. The result? Onchain metrics forecasting that anticipates liquidity crunches or whale movements with graph neural networks analyzing multiple feeds.
dxFeed exemplifies this by piping high-quality financial data into Web3 via oracle tech, empowering dApps with reliable inputs. For traders, this means spotting correlations between forex volatility and BTC dips before they cascade. I’ve leveraged similar feeds to time options entries, watching how blockchain trading signals align with sentiment shifts for outsized returns.
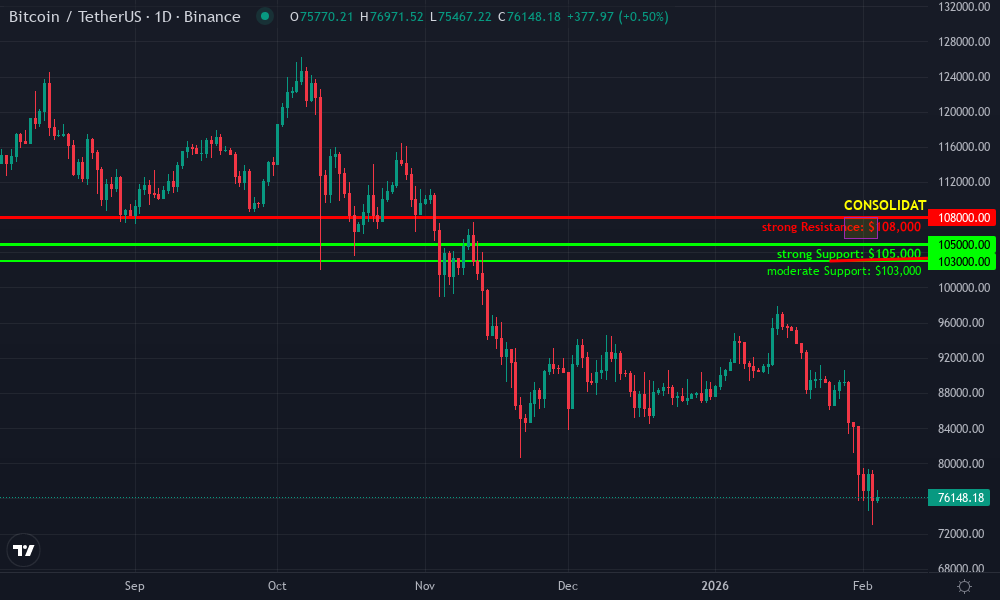
Bitcoin Technical Analysis Chart
Analysis by Market Analyst | Symbol: BINANCE:BTCUSDT | Interval: 1D | Drawings: 6
Technical Analysis Summary
As a seasoned technical analyst with a balanced approach, start by drawing the primary uptrend line from the October 2026 low around 95,000 to the December peak at 108,000, using ‘trend_line’ tool. Add a short-term downtrend line from the December high to the recent February low near 103,000. Mark key support at 105,000 and resistance at 108,000 with ‘horizontal_line’. Highlight the recent consolidation zone from late January to early February between 105,000-107,000 using ‘rectangle’. Use ‘long_position’ for potential entry near 106,000 support. Add ‘arrow_mark_up’ for MACD bullish divergence signal. Place ‘callout’ texts for volume spike descriptions during the uptrend. Finally, draw ‘fib_retracement’ from the major swing low to high for retracement levels.
Risk Assessment: medium
Analysis: Bullish structure intact but near-term overbought with pullback risks; AI enhancements add tailwinds but scam vigilance needed
Market Analyst’s Recommendation: Consider long positions on dips to support with tight stops, aligning with medium risk tolerance
Key Support & Resistance Levels
📈 Support Levels:
-
$105,000 – Strong prior high now acting as support, confluence with 0.618 fib
strong -
$103,000 – Recent swing low with volume support
moderate
📉 Resistance Levels:
-
$108,000 – Recent all-time high, psychological barrier
strong -
$110,000 – Next round number extension target
weak
Trading Zones (medium risk tolerance)
🎯 Entry Zones:
-
$106,000 – Bounce from support zone with bullish candle confirmation
medium risk -
$105,000 – Deeper retracement entry if breaks minor support
high risk
🚪 Exit Zones:
-
$110,000 – Measured move target from pullback low
💰 profit target -
$102,000 – Below key support invalidates uptrend
🛡️ stop loss
Technical Indicators Analysis
📊 Volume Analysis:
Pattern: Increasing on uptrend, climactic spike at peak then declining
Volume confirms uptrend strength, drying up on pullback suggesting exhaustion
📈 MACD Analysis:
Signal: Bullish divergence on pullback, histogram contracting
MACD line above signal with positive momentum building
Applied TradingView Drawing Utilities
This chart analysis utilizes the following professional drawing tools:
Disclaimer: This technical analysis by Market Analyst is for educational purposes only and should not be considered as financial advice.
Trading involves risk, and you should always do your own research before making investment decisions.
Past performance does not guarantee future results. The analysis reflects the author’s personal methodology and risk tolerance (medium).
AI Verifiers: Safeguarding Feeds Against Manipulation
Reliability defines winning in crypto. AI oracles shine here, operating in cross-validation mode to scrub incoming data before blockchain commitment, per Foundico. Binance’s next-gen decentralized oracle deploys AI verifiers that flag abnormal spikes, cross-referencing sources in real time. Frontiers research suggests advanced models tackle the oracle problem head-on, using correlation analysis across feeds to generate robust data points.
Yet, the 2026 landscape reveals both promise and peril. Berry’s AI ecosystem aggregates onchain data for BTC, XRP, and ETH summaries, processing exchange stats for trend detection. ARMA’s non-custodial agents manage over $20 million, delivering 83% yield boosts via session-key controls. ZyFAI echoes this trust, optimizing positions continuously. Dinari and Chainlink’s S and P Digital Markets 50 Index blends U. S. stocks with digital assets, oracle-secured for transparency.
These tools elevate blockchain trading signals, but scams lurk. ‘AI quant’ frauds snagged over 50% of 2024 onchain scam inflows; due diligence is non-negotiable. Stick to verifiable platforms where AI reasoning meets onchain proof.
Empowering Traders with Predictive Onchain Insights
Verifiable onchain analytics isn’t theory; it’s deployable alpha. WunderTrading’s 2025 AI tools harness big data and sentiment for crypto forecasts, while Wilson Center traces oracles’ evolution from Delphi to DeFi lending. Hybrid feeds like those from AI Feed Oracle forecast onchain metrics such as TVL shifts or token velocity, tying them to price action.
Traders gain from real-time fusion: AI detects patterns in live data, onchain states confirm execution feasibility. My strategy? Layer these feeds over options charts, entering high-conviction trades when signals converge. Liquidity flows where alpha grows, and these oracles channel it straight to your positions.
Bitcoin (BTC) Price Prediction 2027-2032
Forecasts leveraging AI hybrid oracles, onchain volume, sentiment analysis, and verifiable market data for traders
| Year | Minimum Price | Average Price | Maximum Price | YoY % Change (Avg from Prior Year) |
|---|---|---|---|---|
| 2027 | $140,000 | $180,000 | $250,000 | +20% |
| 2028 | $160,000 | $220,000 | $320,000 | +22% |
| 2029 | $200,000 | $280,000 | $450,000 | +27% |
| 2030 | $250,000 | $380,000 | $650,000 | +36% |
| 2031 | $320,000 | $500,000 | $850,000 | +32% |
| 2032 | $420,000 | $680,000 | $1,200,000 | +36% |
Price Prediction Summary
Bitcoin’s price is forecasted to experience strong upward trajectory from 2027-2032, with average prices climbing from $180K to $680K (cumulative ~278% growth), fueled by AI-enhanced onchain analytics, halvings in 2028/2032, and institutional adoption. Min/Max ranges account for bearish corrections and bullish surges amid market cycles.
Key Factors Affecting Bitcoin Price
- AI hybrid oracles and verifiable onchain data feeds improving trading accuracy
- Bitcoin halvings in 2028 and 2032 increasing scarcity and historical bull runs
- Rising institutional adoption via partnerships like Dinari-Chainlink S&P indices
- Onchain sentiment and volume analytics from platforms like Berry and ARMA
- Regulatory clarity and tech advancements reducing oracle risks
- Market cycles with potential bear phases balanced by AI-driven yield optimization and DeFi growth
Disclaimer: Cryptocurrency price predictions are speculative and based on current market analysis.
Actual prices may vary significantly due to market volatility, regulatory changes, and other factors.
Always do your own research before making investment decisions.